Page 28 - Nemko - Annual performance - 2020
P. 28

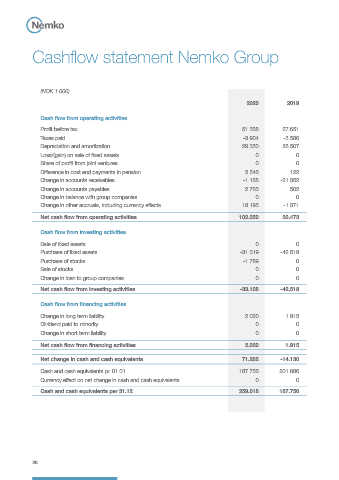
Cashflow statement Nemko Group


               (NOK 1 000)

                                                                                       2020           2019

               Cash flow from operating activities

               Profit before tax                                                      51.568        27.651
               Taxes paid                                                             -3.904        -5.586
               Depreciation and amortization                                          29.350        26.507
               Loss/(gain) on sale of fixed assets                                         0             0
               Share of profit from joint ventures                                         0             0
               Difference in cost and payments in pension                              5.546           122
               Change in accounts receivables                                         -1.168       -21.352
               Change in accounts payables                                             2.763           502
               Change in balance with group companies                                      0             0
               Change in other accruals, including currency effects                   18.195        -1.371

               Net cash flow from operating activities                               102.350        26.473

               Cash flow from investing activities

               Sale of fixed assets                                                        0             0
               Purchase of fixed assets                                              -31.319       -42.518
               Purchase of stocks                                                     -1.789             0
               Sale of stocks                                                              0             0
               Change in loan to group companies                                           0             0

               Net cash flow from investing activities                               -33.108       -42.518

               Cash flow from financing activities
               Change in long term liability                                           2.020         1.915
               Dividend paid to minority                                                   0             0
               Change in short term liability                                              0             0

               Net cash flow from financing activities                                 2.020         1.915

               Net change in cash and cash equivalents                                71.262       -14.130

               Cash and cash equivalents pr. 01.01                                   187.756       201.886
               Currency effect on net change in cash and cash equivalents                  0             0

               Cash and cash equivalents per 31.12                                   259.018       187.756


            26
   23   24   25   26   27   28   29   30   31   32   33